I have been working on automating a few trading strategies that make up a comprehensive long / short trading plan.
I programmed and back-tested using TradeStation with Easylanguage with focus on the ES e-mini contracts.
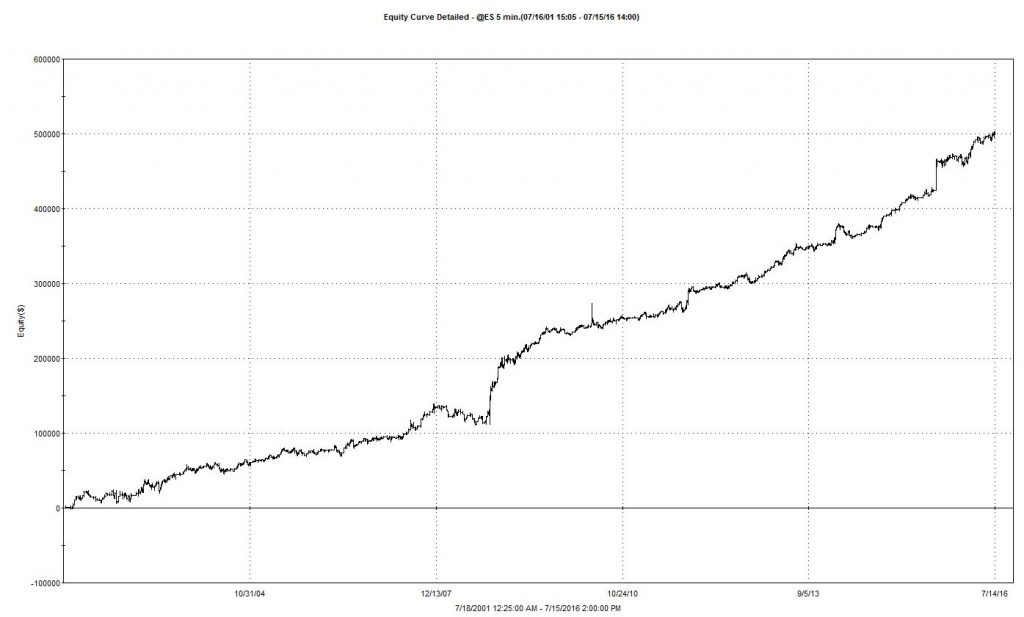
It is a day trading plan, so it only deploys capital during regular trading hours. And it doesn’t trade very often. The average win rate is approximately 60% and the average Win/Lose ratio close to 2:1. It run in simulation mode for 6 months and has been running Live since October 2015 with a 10.3% rate of return. Draw-downs historically (15 years) have been as high as 26% (Jan 2008 – Oct 2008,) so it is not for the faint of heart.
The graph shows the equity curve for the 15 year simulation.
I am also programming the strategy to posts the trades in real time on this blog, so you can follow.
PLEASE FOLLOW AT YOUR OWN RISK. CONTACT YOUR FINANCIAL ADVISER BEFORE TRADING. FUTURES HAVE LEVERAGE AND YOU CAN HAVE SUBSTANTIAL LOSSES. AND REMEMBER, PAST PERFORMANCE DOES NOT GUARANTEE FUTURE PERFORMANCE.

