 |
 |

Trade Analysis |

Trade Stats |
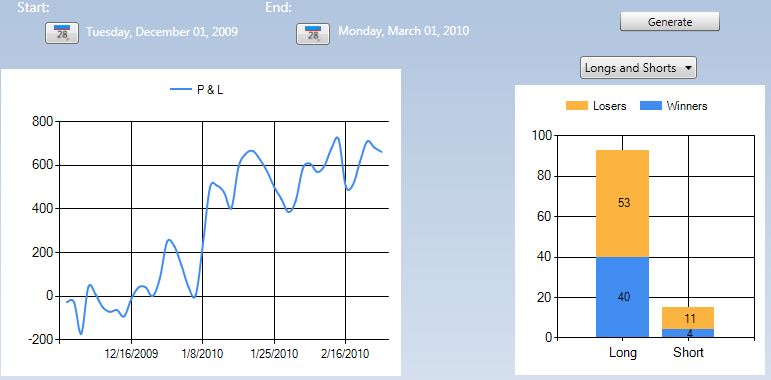
P & L
The Analysis Control generates several key trade statistics and results. The P & L or equity curve displays the cumulative profit or loss for all trades that were opened and closed within the specified date range. No partial positions are taking into account, so it is important that you look at overlapping date ranges. For example, I generate performance analysis reports monthly, bi-monthly and year-to-date.