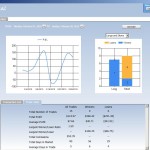
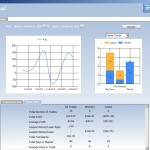
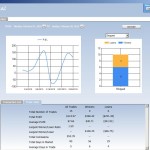
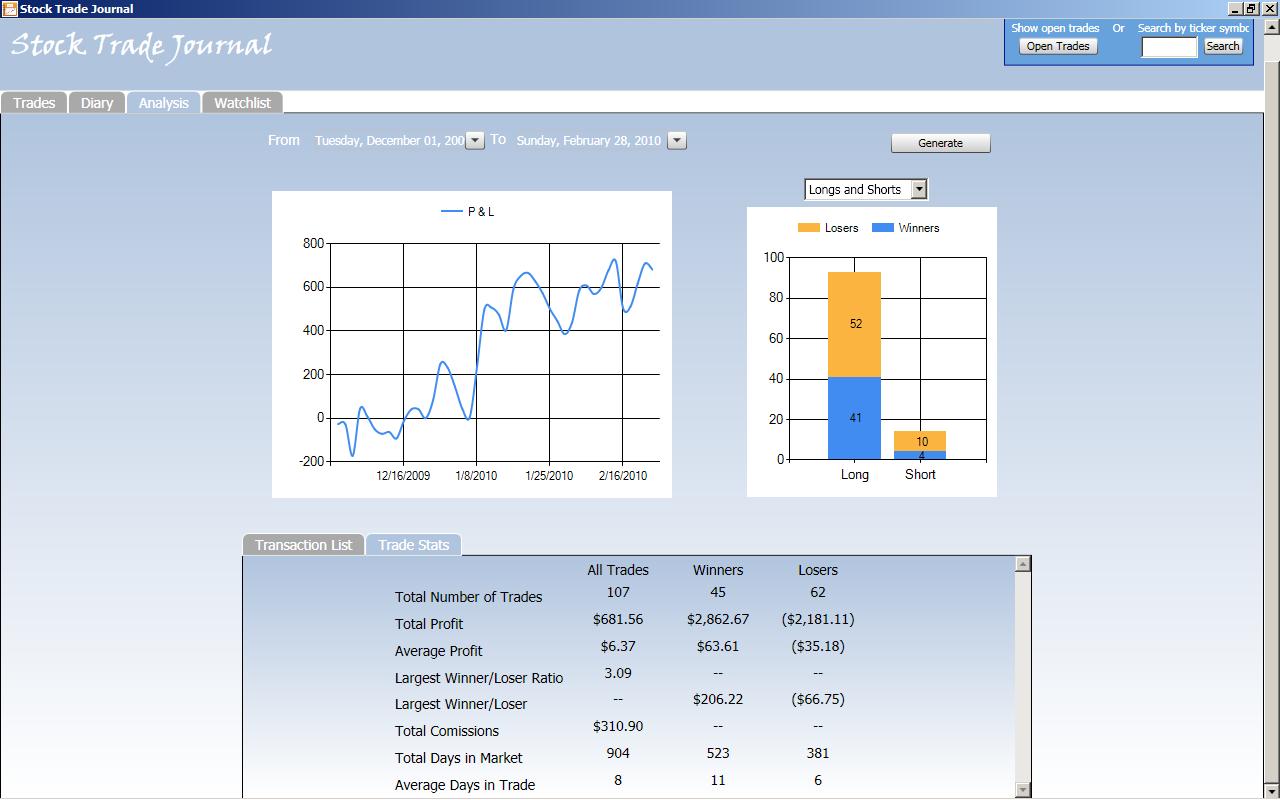
This month I tried to tackle over trading. I decided to limit to 5 the number of trades I could enter in a week. Not necessarily one trade per day, but 5 trades per week. Check out the performance graphs and stats below.
The ratio of winners vs losers improved dramatically and it was a profitable month. However, the largest winner vs largest loser ratio was below 2. What was amazing was that all long positions were winners but more than half of the shorts were losers. Although it was a profitable month, the winnings were very small. This is shows that there is a correlation between the largest winner vs largest loser ratio and the amount of money you make. The numbers also show that I didn’t deploy as much cash as in previous months and that if I want to stick to the 5 trade per week limit I need to increase position size to maintain the same level of risk. I also realize that I need to look for better R/R opportunities.
Notice that I was stopped out for profit more than I was stopped out for a loss. Meaning that I was more effective in proactively managing stops as trades began to move my way. Also, I had more winning trades when the market was moving higher.
Reading my notes in the Diary section of my journal I found that a common theme was a lack of an overall market edge and that the memories of being whipsawed last month are still fresh. I did manage to pull the trigger on a number of shorts and I will continue to fine tune scans to generate short opportunities.
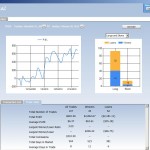
The last picture is a chart of the total performance since Dec. last year when I began to Twitter my trades.

