I have been paying more attention to the TICK and ADV, DECL lately and noticed a pretty useful way to use these indicators to tell me the direction of the market for the day or when it is about to change. Below is my Journal entry today.
Noticed how the $ADV and $DECL behave as the market changes direction:
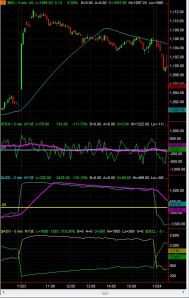
When the market trends higher I noticed that the $TICK in a 5 min chart remains mainly above the zero line. It is easier to visualize plotting a 20 MA over the chart. The opposite is true for a down trending market. The TICK remains mainly below the zero line.
Also noticed that when the market trends higher the ADV are usually above 2,500 and the DECL remain below 1,000. For down trending markets the opposite is true, DECL above 2,000 and ADV below 1,000.
In a range bound day the TICK remains very close to zero and the ADV and DECL are usually both close to 1,500.
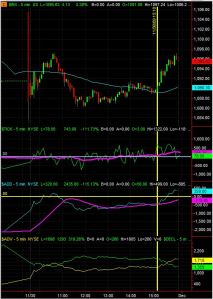
Today I saw that there was a strong closing coming when the ADV and DECL changed direction on the chart and moved to the up trending market ranges. The 20 MA on the TICK chart hooked higher and remained above zero for the remaining of the session.
Take a look at the chart below to see what I mean.


