
Not a very good month as I tried to trade the E-mini S&P 500 and I continued to have problems with the platform which made things more stressfull. In any case, the performance charts and stats for september reflect the volatility compounded by the leverage of the E-mini. I also included the stats starting Dec 09 when I began to twitter all my trades live.
I am going to concentrate most my efforts in trading the E-mini rather than to try to continue to pick stocks. I believe now that it is going to be better for me in the long run to master one instrument. I am in the process of releasing an update to the Stock Trade Journal that allows to enter a “Leverage” number for a trade. For example, in the E-mini S&P 500 the “Leverage” is 50. Meaning that every point move in the S&P 500 corresponds to a $50 move in the P&L
-
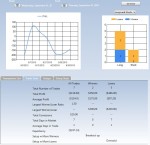
- Dec. 2009 – Sept. 2010 Performance
-
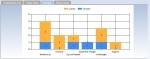
- Aug. – Sept. 2010 Setups
-
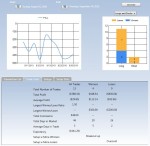
- Aug. – Sept. 2010 Performance
-
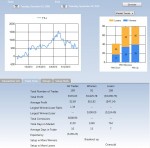
- September 2010 Performance