
Goldman Sachs (GS) is trying to break out today again. It keeps failing around $172 but the charts show high probability it will succeed. In addition to the wedge, there is an inverse head and shoulders pattern that formed in the past few days. That combined with the break of the long term down trend gives the break a high probability. Being patient here though and waiting for the break to be confirmed.
-
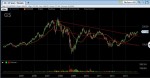
- GS Weekly Chart
-
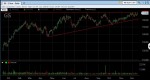
- GS Daily Chart
-
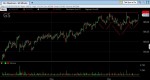
- GS 60 Min Chart