
Citigroup (C) is trying to break out above $54 following the lead of other banks. It had a very strong day Friday and it is supported by the relative strength in the financial group. The prices in the chart indicate that there is little technical resistance beyond $54 and until $100, so economic and fundamental date will drive its price moving forward.
-
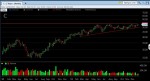
- C Weekly Chart
-
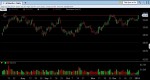
- C Daily Chart