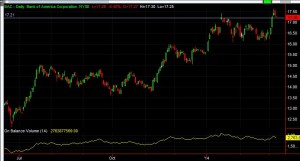
Bank of America (BAC) broke out from a triangle pattern last Tuesday with a very strong follow through Wednesday. It pulled back a bit Friday but held above $17.20 that was prior resistance in January. I expect some consolidation to take place here before it resumes higher. My target is $20.
-
Archives
- January 2018
- December 2017
- November 2017
- October 2017
- September 2017
- August 2017
- July 2017
- June 2017
- May 2017
- April 2017
- March 2017
- February 2017
- January 2017
- December 2016
- November 2016
- October 2016
- September 2016
- August 2016
- July 2016
- June 2014
- April 2014
- March 2014
- February 2014
- January 2014
- December 2013
- November 2013
- October 2013
- January 2012
- December 2011
- November 2011
- September 2011
- August 2011
- July 2011
- June 2011
- May 2011
- February 2011
- January 2011
- December 2010
- October 2010
- September 2010
- August 2010
- July 2010
- June 2010
- May 2010
- April 2010
- March 2010
- February 2010
- January 2010
- December 2009
- November 2009
-
Meta

