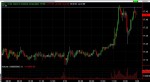
Bank of America (BAC) tested its March 5th break out level and rallied on a weak market. This is very bullish for the stock. It printed an inverse head and shoulders pattern (5 min chart) yesterday that needs to be confirmed by moving above $17.50 today before deploying more cash. My target is still $20.
-
-
BAC 5 min Chart
-
-
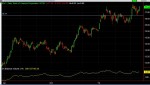
BAC Daily Chart
About Stock Trade Journal
The information in this blog is not investment advice. Please consult a financial advisor before investing. I have been trading stock since the 1990's and survived the .com crash. I am developing software applications to help me trade better and now I am making them available to help other traders.
This blog is also a way to share my experiences and observations in the market.