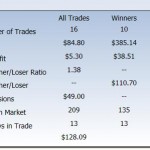
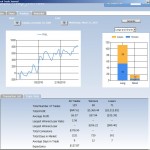
Another month has gone by and it is time to evaluate my trading performance. In March I continued my battle with over trading by limiting the number of trades per week to 5. I tried to concentrate on better quality setups and it helped me improve the number of profitable trades vs losing trades. This month I added a new measure to the StockTradeJournal called “Expectancy” which is basically the kind of profit you can expect for a given time period based on your averages. It basically uses the average win times the average dollar gain minus the average lose rate times the average dollar loss. It captures both the “Batting average” and the Reward / Risk in trading. I am seeing some improvement in the average performance as you can see in the screen captures below.
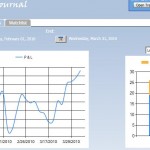
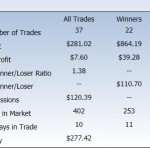
Overall I see a big improvement in the expectancy since december. I also looked at both February and March combined since there were a number of trades that were initiated in Feb. and exited in March. But I am still concerned about the R/R ratio being way below 3. From the P&L graph I can see that in the Dec – Jan period I had a poor Win vs Loss record, yet I was more profitable which emphasizes the importance of having a high R/R.The StocTradeCalc should come in handy to improve that ratio as long as I interpret the charts correctly.
Next month I will try to improve on my R/R while still limiting the number of trades.
- March Stats
- December To March Performance
- February and March Graphs
- February and March Stats
- March Graphs

