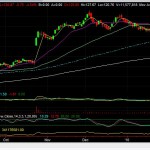
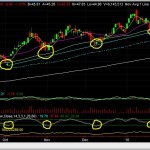
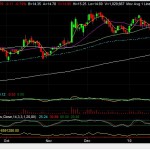
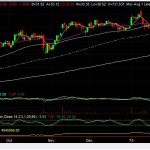
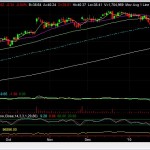
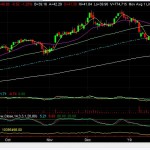
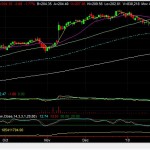
There are about 100 stocks that I monitor closely for trading opportunities. Most of these stocks were trading above their 200, 50 and 20 DMAs a couple of weeks ago, but now the majority are trading below their 20 and 50 DMAs. And the 20 and 50 DMAs are crossing each other in some charts to signal more weakness. I was traveling since Wednesday until Friday evening so I couldn’t monitor the price action last week to see what the order flow was like. Specially Friday when the heavy selling took place. However, looking at my charts I see that now the 20 and 50 DMAs are resistance in many charts. It seems like candles are being pushed towards their 200 DMA.
I continue to adjust my targets a bit lower and I have been able to lock in some gains, but last week I was stopped out on gaps with losses that were greater than expected in a couple of stocks. I am going to experiment with ldrogen’s ATR formula for position sizing and stops to try to account for that risk.
I failed sell any stocks short again, but I now have the moving averages and crossings to target any rips to sell. Of course I will be monitoring the tape to confirm if the sellers are still coming out in force.
On the long side there are a number of setups showing up on oversold conditions that I am going to play again. Remember BTU? Well, the pattern is almost complete to signal an entry. We might get it in two or three days and I will get long again. If these pattern fails to repeat, then it will reinforce the notion that we are in an aversion phase and that there is possibly further downside pressure.

