In previous posts I talked about position sizes and Reward / Risk ratios as important aspects of any Risk Management methodology for traders. Today I am going to share with you how I use these concepts in my trading with a specific example.
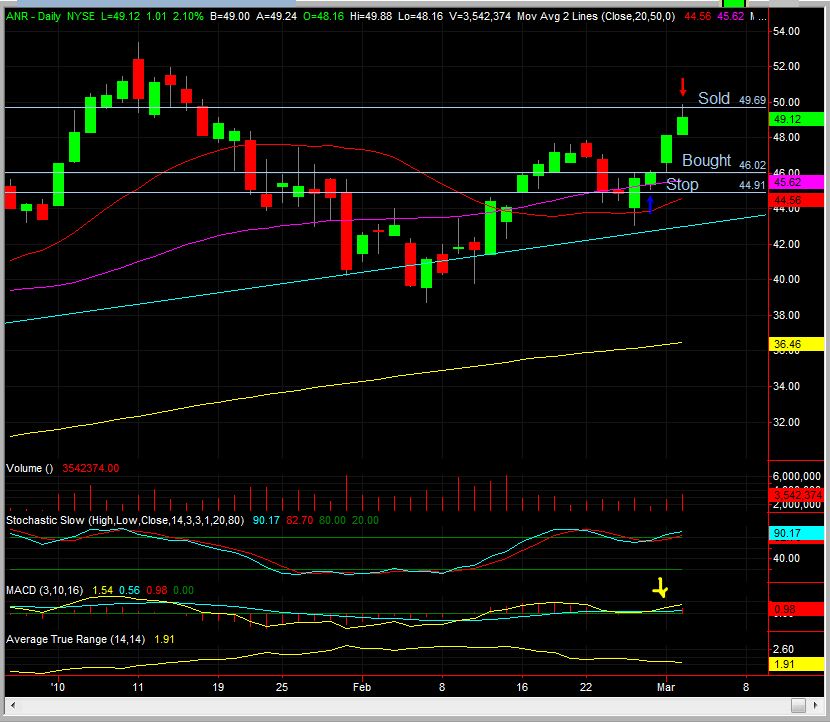
In the daily chart of ANR below you can see that the stock had a really strong day on Feb. 25th and the MACD was beginning to move higher. The over bought conditions had been removed thanks to the recent pullback and could provide a good entry. The next day the chart offered that opportunity. The stock continued to show strength and presented a good R/R with a stop just below the day’s lows and with a target at the bottom of January’s trading range. Using the formulas on the previous posts (or using the StockTradeCalc) the Reward / Risk turns out greater than 3 with a target of $49.69, a stop at 44.89 and an entry close to $46. The number of shares to buy for a $50 risk is 44.
Often, I use these concepts to set alerts to let me know that the optimum price for a good R / R has been reached. I do this by looking at supply and demand areas as natural places to put target and stop exits. I have used ATR based stops in the past as well. Leigh Drogen has an excellent post on how he uses ATR to manage risk here. If you know that you want a R / R equal to 3 or greater, you can determine what the ideal entry price would be. When alerts fire at that optimum entry price, I don’t just enter the trade blindly, but if the fundamentals or technicals haven’t changed then it is a go and I pull the trigger. I do my homework after market hours by setting this kind of alerts and by making cross references with journal entries and watch lists.

