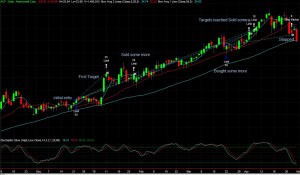
I spent some time analyzing a trade that was stopped out last week for ticker ACF.
I had been stalking $ACF after it showed up in TheKirkReport’s awesome Stock Screen Machine and set up an alert to let me know that the stock was beginning to move out of its multi-week trading range. When the alert triggered I bought at $19.19 and placed my stop just below $18 with initial target at $21.38 which was reached in January 11th. The stock gave back some gains the next few days and I began to think that it wouldn’t run up any more and sold some more close to the first price target.
I kept 1/3 of the position as I usually do and set up a Vervoort ATR trailing stop (purple line.) ACF continued to climb slowly, but steadily for two months and offered two opportunities to re-enter in March. I bought some more on March 22nd when the intraday chart showed that the buyers were stepping in at the 20 DMA (red line.) In usual fashion I swing traded it and sold 2/3 of it while keeping the remaining with the ATR stop.
The sell signal triggered on April 28 and sold the remaining shares I had. The total return for that trade was about 30%.
This stock is getting oversold and might offer a good entry soon. I will be keeping an eye out on it.

