
Citigroup has been stuck in a trading range since April this year. It encountered resistance around $50 back in August 2008, April 2010 and January 2011.
What is interesting on the chart this time is that the 200 DMA has been trending higher. I am looking at a trade if it breaks $52 for a $65 target with a stop just below $48.
The Reward / Risk for the trade is 3:1
-
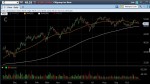
- C Daily Chart
-
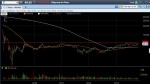
- C Weekly Chart