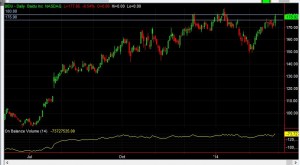
Baidu (BIDU) broke out off an eight day trading range and moved back up to last year’s highs yesterday. It hit my trigger price around $169 at the bottom of the trading range last Tuesday, but somehow I didn’t get filled. If yesterday’s breakout holds and price stays above $176, then an inverse head and shoulders measured move from this month lows would take us to $203.
-
Archives
- January 2018
- December 2017
- November 2017
- October 2017
- September 2017
- August 2017
- July 2017
- June 2017
- May 2017
- April 2017
- March 2017
- February 2017
- January 2017
- December 2016
- November 2016
- October 2016
- September 2016
- August 2016
- July 2016
- June 2014
- April 2014
- March 2014
- February 2014
- January 2014
- December 2013
- November 2013
- October 2013
- January 2012
- December 2011
- November 2011
- September 2011
- August 2011
- July 2011
- June 2011
- May 2011
- February 2011
- January 2011
- December 2010
- October 2010
- September 2010
- August 2010
- July 2010
- June 2010
- May 2010
- April 2010
- March 2010
- February 2010
- January 2010
- December 2009
- November 2009
-
Meta

