I often wondered how well I traded a particular setup. Do I anticipate and get in too early? Do I enter too late and miss the move? Looking at and reviewing past trades can help bring light to aspects of trading that need improvement. A few weeks ago I received great feedback about the Stock Trade Journal software and a request to add the ability to track and produce trade statistics based on Setups. Tagging setups was something I had been contemplating, but the request made me start the project right away. In designing and writing the software I realized how little I really knew about how I traded different setups and most important what the setups themselves told me about the price action and market direction.
In updating the software I tagged each trade to a setup and coded a mechanism to manage a list of current setups. That way I could enable and disable what I favored in the future. Each setup is now tracked for performance and other stats like expectancy. I tagged each trade I made since I began to twitter my trades and generated bar graphs for winners and losers.
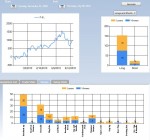
The screen captures are below. The funny thing is that the setups that I thought I was very succesful at trading turned out to be among the worst and viceversa. I guess my brain remember only the most dramatic trading experiences and ignored the rest. But adding the numbers changed my perception and helped me come up with actionable items to improve.
From my setup statistics below you can see that I traded the Flag Pole pattern poorly and that the breakouts were among my best. It turns out that I anticipated entering Flag Pole patterns which resulted in losing trades, but more than half of breakouts were profitable and breakouts contributed the largest sum to my winnings. Looking at the statistics I also realized that bottom fishing for me has been a losing proposition. Trading oversold stocks often lead to more downside and loses.
- Breakout Stats
- Dec09-July Setups
- Flag Pole Setup
- Oversold Setup
- TradeStats Dec 2009 to June 2010


