Another month has gone by and it’s time to look at how I traded.
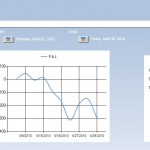
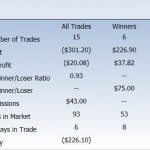
The first P&L graph shows a net loss for trades that where both initiated and closed in April. The bar graphs on the right show that there were more losing trades. I had a winner / loser ratio below 1 and to make things worse I also had a negative Expectancy. All those show a poor trading pattern.
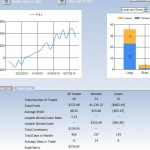
But taking a look at the cumulative performance between March and April, because there were trades initiated in March that I closed in April, I see a different picture. The picture here is more complete and shows a positive P&L with a much better Expectancy. And for the first time I was able to increase to 3 the ratio between the largest winner and loser. That is a much encouraging report.
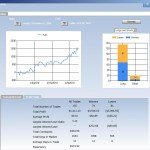
Also, it is particularly important that I look at my performance since December 09, when I began to twitter all trades, because I closed a position in $ACF that was initiated that month. That trade represents the largest profit to date. The P&L graph for this multi-month period continues its upward trend and the number of winners – for long trades – is now a bit greater than the losers. On the short side, however, winning trades are less than half of their losing counterpart, but the Expectancy improved considerably.
- April P&L
- April Trading Stats
- Dec to Apr 2010 Performance
- March To April Analysis
On the thought journaling side I found several entries where fear and euphoria took hold. I am noticing that these mixed emotions begin to show at short-term market turning points. I tried to concentrate on finding companies that beat expectations this earnings season, but sometimes is best to step aside.
I also noticed the urge to place trades to recover loses this past week and had to really fight those feelings and stick to the 5 trades per week plan. That training strategy is working, but I feel I need to take it one step further and try to limit to at most one trade per day. This way I really have to be selective and work harder at finding and entering only the best setups.
That is the path I am going to take next month.


