
Metlife (MET) bounced of the 50 DMA last Friday on heavy volume. It has been trying to move above strong supply around $50 since august. A bull flag pattern is forming on the 60 min chart that can help me define risk for a trade. I am defining my entry above $50.50 and a stop below $49.29 with a target of $59. My Trade Calculator tells me the reward / risk for this trade is 7:1. In my Journal I have noted many times that these bullish patterns also tend to fail if the market itself is showing signs of weakness. So not only am I keeping an eye on the SPY and IWM for market direction, but also on the sector via the XLF.
-
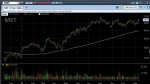
- MET Daily Chart
-
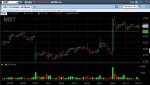
- MET 60 min Chart
-
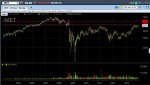
- MET Weekly Chart